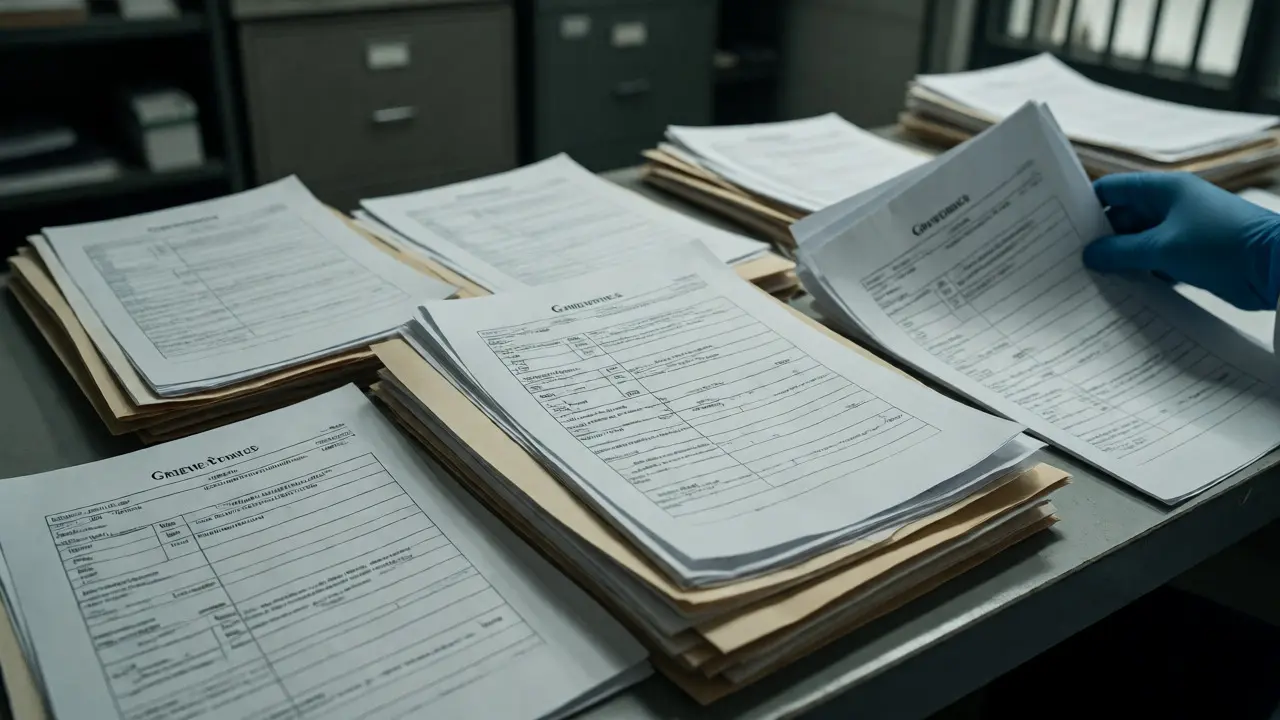
Most people think of inmate grievances as just paperwork-annoying forms that sit in a pile until someone finally stamps them. But if you look closer, those stacks of paper are actually one of the most honest data sources we have about what is really happening inside a correctional facility. They aren't polished reports from administrators trying to look good for state auditors. They are raw, unfiltered signals of friction, dissatisfaction, and systemic breakdowns. When a specific complaint pops up repeatedly, it isn't just noise; it's a trend screaming for attention.
The Hidden Data in Plain Sight
Think about your last bad experience at a restaurant. You might not write a formal letter, but you probably told three friends. Now imagine if every single unhappy customer had to fill out a standardized form before they could leave. That’s roughly how the grievance system works. Because inmates have limited outlets to voice dissatisfaction, the grievance form becomes their primary megaphone. If you ignore it, you’re ignoring the only direct feedback loop you have from the population you serve.
Why does this matter now? Because traditional metrics like recidivism rates or incident reports often lag behind reality. By the time violence spikes or a lawsuit lands on your desk, the warning signs were already visible in the grievance logs months earlier. Tracking these trends allows facility managers to shift from reactive firefighting to proactive problem-solving. It turns anecdotal evidence into actionable intelligence.
Identifying Systemic Friction Points
When you start categorizing grievances, patterns emerge quickly. Maybe there’s a sudden uptick in complaints about food quality in Block C. Is it a supply chain issue? A staffing shortage in the kitchen? Or perhaps a change in menu planning that ignored cultural dietary needs? Without tracking, you might blame individual "difficult" inmates. With tracking, you see a cohort-level problem.
Consider medical access. This is consistently one of the top categories for grievances across the United States. The Federal Bureau of Prisons (BOP) requires detailed logging of these claims. If you notice a spike in grievances citing "delayed appointment," you aren't just looking at angry patients; you're looking at a bottleneck in scheduling software, understaffed clinics, or transportation delays within the facility walls. These are operational failures, not just interpersonal conflicts.
To make sense of this volume, facilities need to move beyond simple counts. Raw numbers don’t tell the whole story. A high number of grievances doesn't always mean a bad facility-it might mean an accessible, functioning grievance system where inmates trust the process. Conversely, low numbers might indicate apathy or fear of retaliation. Context is king here.
Grievances as Early Warning Systems
One of the most powerful uses of grievance data is predicting unrest. Research suggests that spikes in non-violent grievances often precede violent incidents by weeks or even months. When inmates feel unheard regarding minor issues-like laundry schedules or visitation rules-that frustration accumulates. Eventually, it boils over into more disruptive behavior.
Let’s look at a concrete example. Suppose a new policy restricts commissary purchases. Initially, you might see a small rise in grievances complaining about cost. If those grievances are denied without clear explanation, the tone shifts. Complaints become more aggressive, citing "rights violations." If leadership ignores this escalation, the next step might be a hunger strike or a work stoppage. By tracking the sentiment shift in the text of the grievances, not just the category, administrators can intervene before the situation explodes.
This predictive power relies on consistent coding. Staff must be trained to tag grievances accurately. If a complaint about a rude guard is miscoded as a "general inquiry," you lose the signal. Standardization is the backbone of reliable trend analysis.
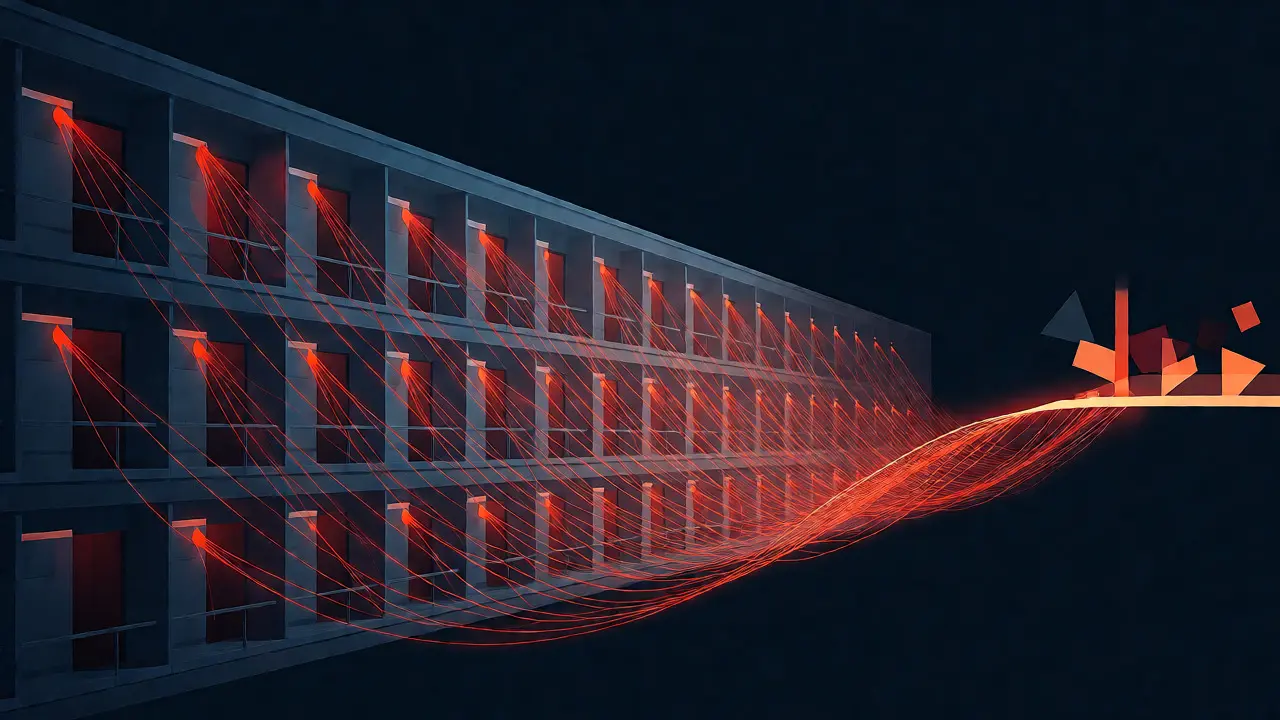
Comparing Metrics: Grievances vs. Incident Reports
It’s easy to confuse grievances with disciplinary incident reports. They are related but distinct entities. Understanding the difference helps you use each tool effectively.
| Metric | Source of Trigger | Primary Focus | Timeframe for Action | Administrative Value |
|---|---|---|---|---|
| Inmate Grievance | Inmate-initiated | Conditions, services, staff conduct | Proactive / Preventative | Identifies systemic flaws & satisfaction gaps |
| Disciplinary Incident | Staff-initiated | Rule violations, safety breaches | Reactive / Punitive | Measures compliance & enforcement activity |
Notice the asymmetry. Incidents tell you what broke. Grievances tell you why it might break next. If you only track incidents, you’re driving while looking in the rearview mirror. If you track both, you get a 360-degree view of facility health. For instance, a drop in disciplinary incidents might look great on paper, but if it coincides with a sharp rise in grievances about "excessive force," you know the reduction in tickets came from staff hesitation, not improved behavior.
Operationalizing the Data
So, how do you actually use this info? First, establish a baseline. What is the normal grievance rate per 100 inmates for your facility? Once you have that benchmark, deviations become meaningful. Next, segment the data. Don’t just look at the total count. Break it down by:
- Unit/Housing Area: Is the problem localized to one wing?
- Category: Medical, property, staff interaction, programming?
- Outcome: How many are upheld vs. dismissed? A high dismissal rate with no explanation breeds distrust.
- Timeline: Are complaints spiking after shift changes or during specific seasons?
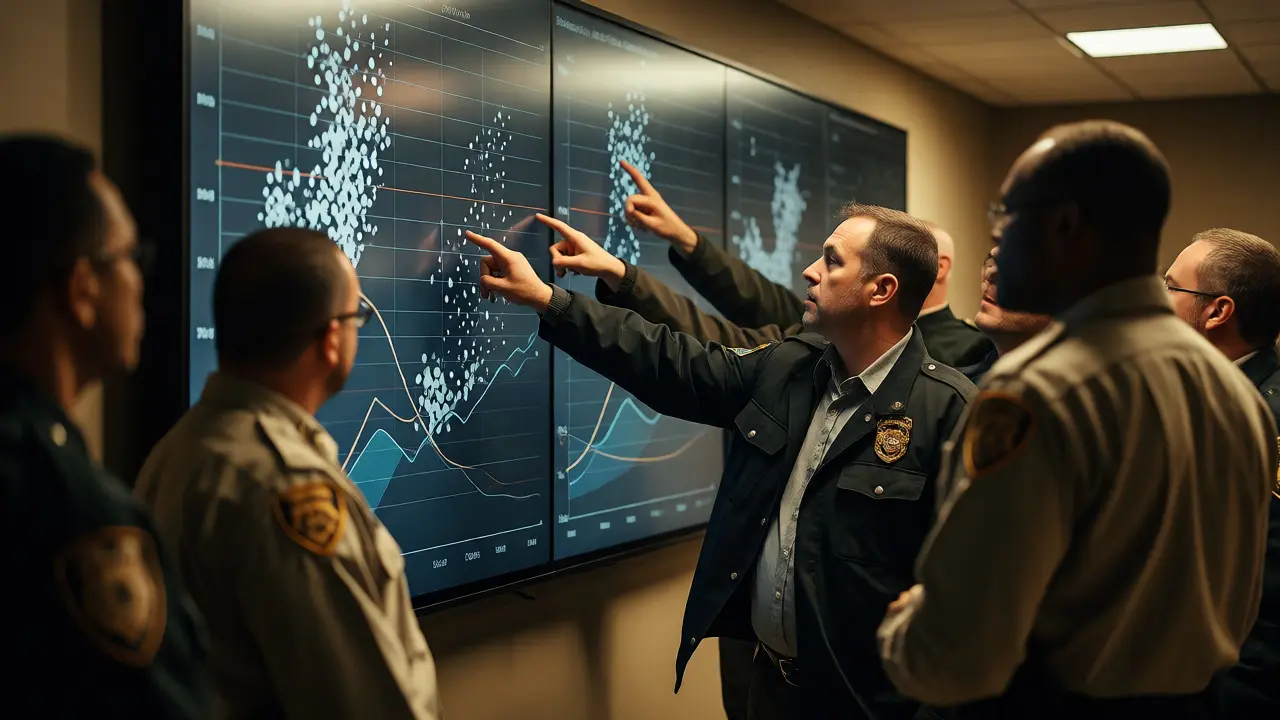
Many modern corrections departments use software like Tyler Technologies’ Offender Management System or specialized tools like JailTracker to automate this tagging. But technology alone isn’t enough. You need regular review meetings where command staff actually reads the narratives. Skimming the summary line misses the nuance. Reading the actual text reveals whether an inmate is frustrated by bureaucracy or genuinely unsafe.
The Human Element Behind the Numbers
We can’t forget that behind every data point is a person navigating a high-stress environment. When an inmate files a grievance, they are exercising a right granted by the Supreme Court case Procunier v. Martinez, which established that prisoners retain certain constitutional rights. Ignoring the trend isn’t just poor management; it’s a potential liability.
Moreover, responsive grievance processing improves institutional culture. When inmates see that complaints lead to tangible changes-like fixing a broken heater or adjusting a meal schedule-they begin to trust the system. Trust reduces tension. Lower tension means fewer violent incidents. It creates a positive feedback loop. Conversely, when grievances disappear into a black hole, cynicism grows. And cynical populations are harder to manage.
For correctional officers, understanding this dynamic is crucial. Knowing that their interactions are being tracked via grievance trends can encourage professionalism. It’s not about surveillance for punishment’s sake; it’s about accountability that protects both staff and inmates. A well-managed grievance system acts as a pressure valve, releasing steam before the boiler bursts.
Challenges in Trend Analysis
Of course, it’s not all smooth sailing. Bias is a real factor. Some inmates file grievances strategically to gain privileges or delay transfers. Others never file because they fear retaliation. This under-reporting skews the data. To mitigate this, compare grievance rates across demographic groups. If one group has significantly lower filing rates despite similar demographics, investigate why. Is there a language barrier? Lack of knowledge about the process?
Another challenge is resource allocation. Reviewing thousands of grievances takes time. Many facilities are understaffed, leading to backlogs. When the backlog grows, the data loses its timeliness. A trend identified six months late is less useful than one caught today. Automating initial triage using natural language processing (NLP) tools can help flag urgent keywords like "assault," "medical emergency," or "suicide" immediately, prioritizing them for rapid response.
Looking Ahead: From Reactive to Predictive
The future of corrections lies in predictive analytics. Imagine a dashboard that alerts you when grievance volumes in a specific unit cross a threshold correlated with past riots. That’s not science fiction; it’s available tech today. By integrating grievance data with other streams-such as phone call sentiment analysis or visitation logs-you build a comprehensive risk profile for each housing block.
For policymakers and facility directors, the takeaway is clear: Stop viewing grievances as administrative burdens. Start treating them as strategic assets. They offer a rare glimpse into the lived experience of incarceration. By listening to these signals, you improve safety, reduce litigation costs, and uphold the dignity of the justice system. The trends are already written in the paperwork. You just have to read them.
How often should facility leaders review grievance trends?
Ideally, weekly for immediate operational issues and monthly for broader strategic trends. Weekly reviews allow staff to address acute problems like food service errors or equipment failures before they escalate. Monthly reviews provide a better sample size for identifying systemic patterns, such as seasonal spikes in medical complaints or long-term effects of policy changes.
Does a high number of grievances mean a facility is poorly run?
Not necessarily. A high volume can indicate that inmates trust the system and believe their complaints will be heard. Conversely, a very low number might suggest apathy, lack of awareness of rights, or fear of retaliation. Context matters more than raw numbers. Compare rates against similar facilities and analyze the outcomes (upheld vs. denied) to gauge true facility health.
What are the most common categories for inmate grievances?
The most frequent categories typically include medical care access and quality, staff conduct (including perceived rudeness or excessive force), property loss or damage, and food service issues. Legal mail delays and visitation restrictions also frequently appear, particularly in facilities undergoing policy transitions or experiencing staffing shortages.
Can grievance data predict violent incidents?
Yes, studies suggest a correlation between rising grievance volumes, particularly those citing staff misconduct or poor living conditions, and subsequent increases in disciplinary incidents or violence. Grievances act as a leading indicator, providing a window for intervention before physical confrontations occur. Monitoring the sentiment and frequency of complaints about authority figures is especially predictive.
How does technology help in tracking these trends?
Modern offender management systems use automated coding and dashboards to visualize data in real-time. Advanced tools employ Natural Language Processing (NLP) to scan grievance text for key themes and emotional tone, flagging urgent issues or emerging clusters faster than manual review. This allows for quicker decision-making and more accurate long-term forecasting.